")
")
User guide:
The PetroVision Databank supports the storage of many formats of geological and geophysical and field information, as well as documents with a standardized structure. The Data Bank includes a number of auxiliary applications for accessing information that allow you to automatically recognize data and visualize it. In doing so, the user can independently customize the viewing within each application.
Formats
The table shows the formats available for viewing using the applications. Depending on the format, the Data Bank automatically determines which application to open a particular file with.
|
ArchiveViewer |
LogViewer |
|
|
|
SegyViewer |
ImageViewer |
|
|
Features
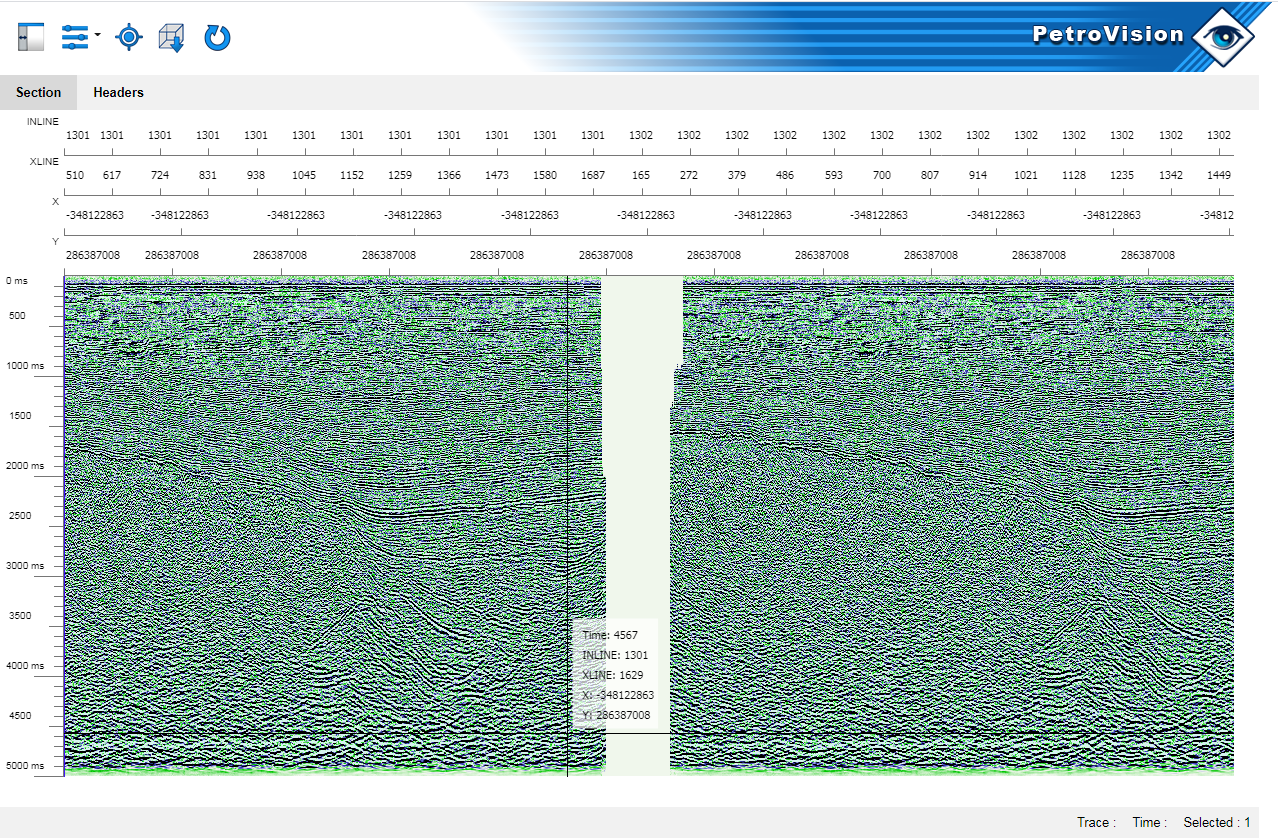
SegyViewer
This application allows not only to visualize seismic data (surveys and profiles), but also helps to customize their display in accordance with the user’s needs.
Data visualization and analysis are conveniently organized with the help of settings for the following parameters:
|
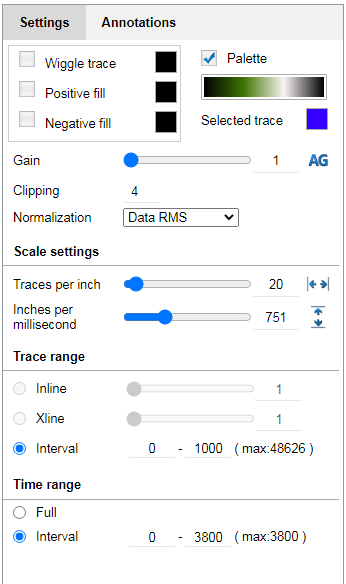 |
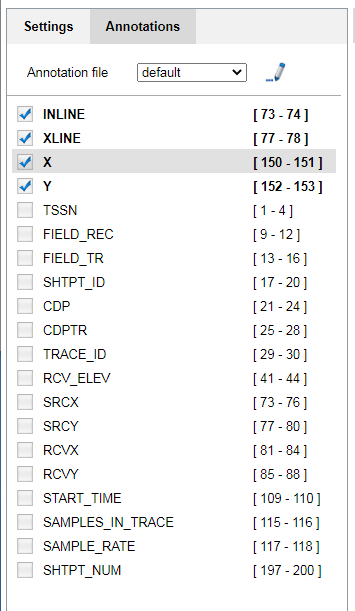 |
Also, the application implements saving settings in the form of schemes for subsequent work with them, and a preset set of schemes for visualization.
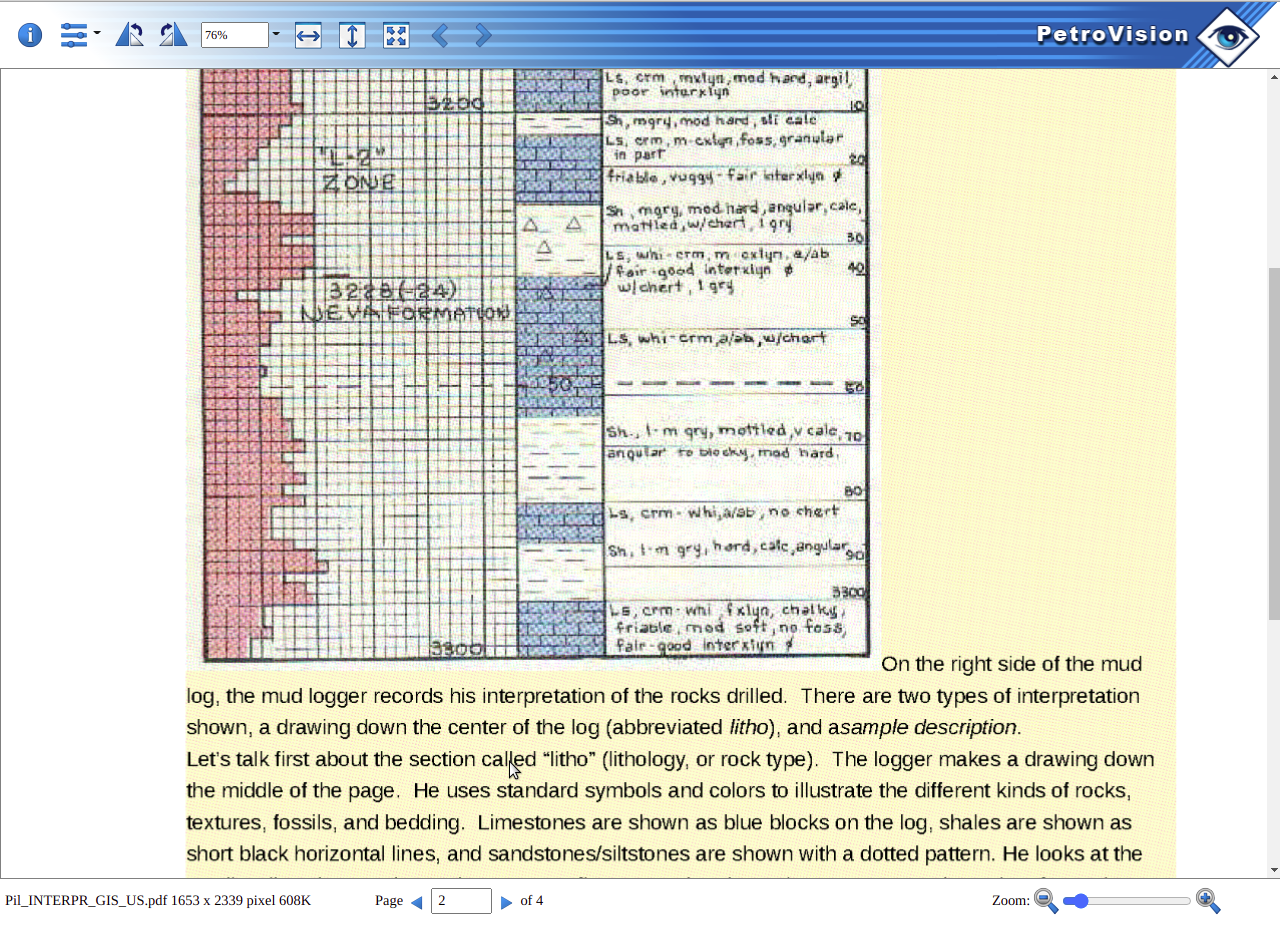
LogViewer
The Log Viewer application for PetroVision is an auxiliary utility for viewing the results of geophysical surveys carried out at all stages of the well life cycle.
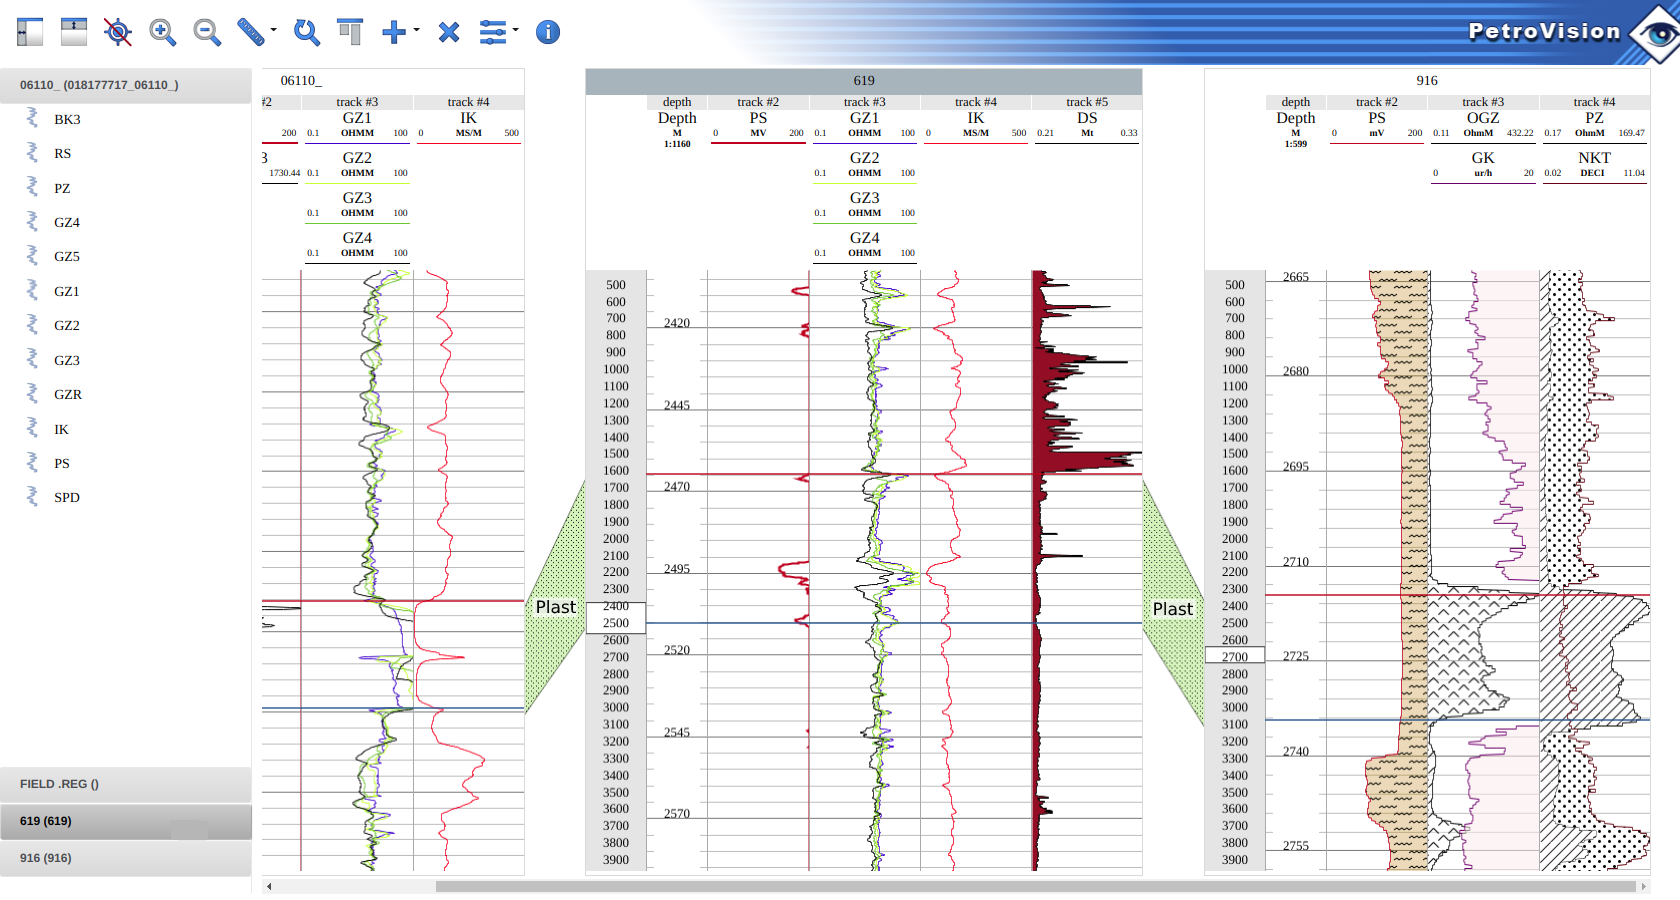
The application gives an opportunity to visualize the results of geophysical surveys, as well as customize their display according to the needs of the user. The following functionality has been implemented:
-
Adding/removing curves;
-
Setting the display range of the curve
-
Changing depth and scale;
-
Changing the color interpretation of curves, including filling;
-
Possibility of assigning markers for marking horizons;
-
Saving all the listed settings in the form of schemes;
-
Working with a predefined set of schemes for each user.
The display is organized by wells, regardless of the number of documents. It is convenient to compare data on a common tablet.
In addition to displaying well log curves, the application implements tracks that display specialized information: for example, data on lithological layers or perforations.
ImageViewer
ImageViewer is an auxiliary utility for viewing images and documents in the abovementioned formats. Visualization of office documents is based on the OpenOffice software package - ImageViewer converts them and displays data in PDF format.
The application allows you to scale the document for easy viewing of data, remember the scale for multi-page documents, and also change the display quality (the number of colors used in the palette when rendering).
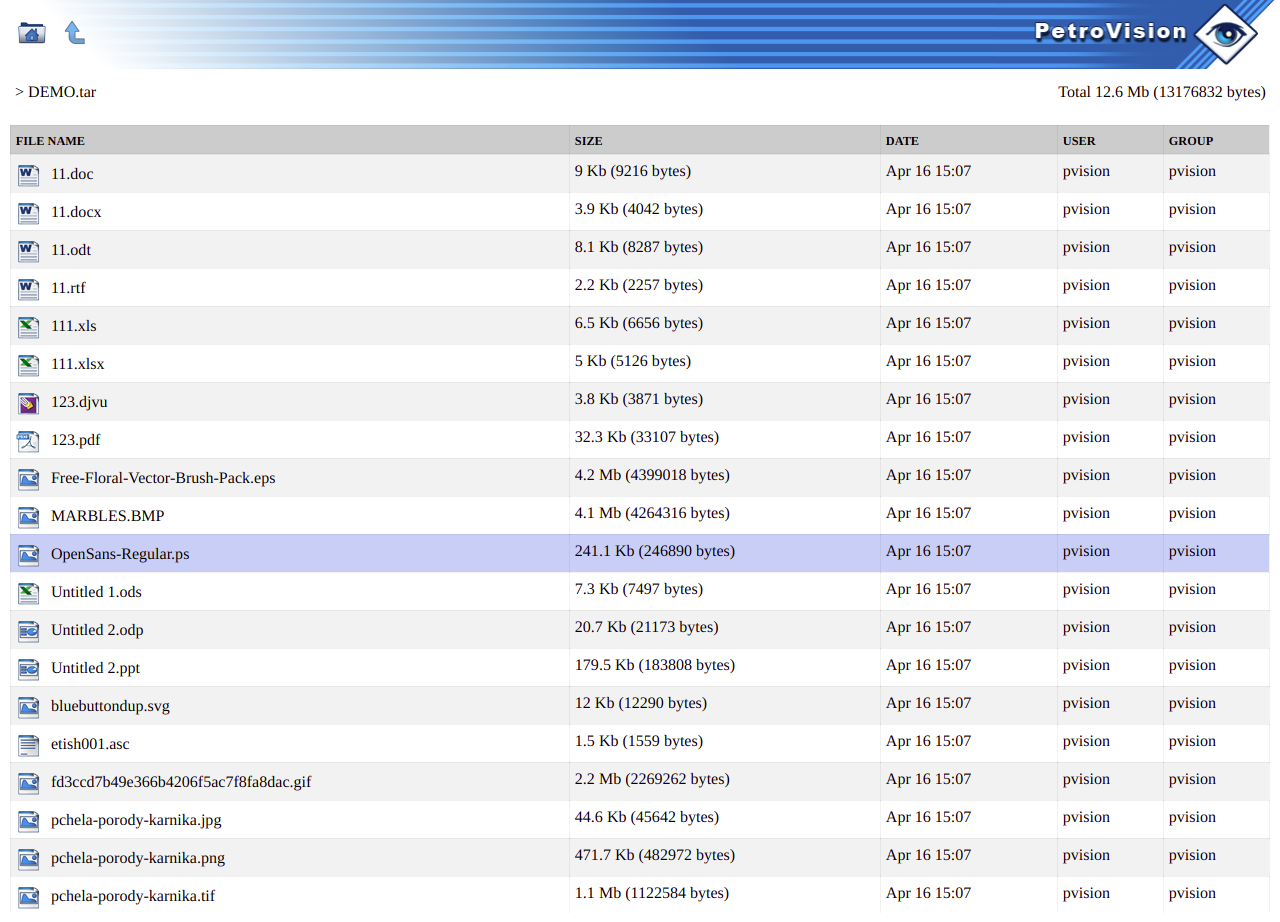
ArchiveViewer
This application allows you to interact with archives and view the contents of files and directories contained in them.
Maintenance
The software product is tested at every stage of its life - from the initial realization of the idea to its implementation - but the support does not end there. Another advantage is a possibility to communicate with technical support, ready at any time to clarify the situation and quickly resolve the issues that have arisen, as well as timely transfer information to the developers for making changes.
Development prospects
Software development does not stand still; in the near future it is planned to release functionality for organizing data viewing in 3D, which allows viewing seismic surveys, profiles and time sections linked to well log data (binding to real coordinates, directional survey, etc.).
In parallel, work is underway to improve the existing functionality and expand the range of readable formats.